StockBull is a mobile application (iOS) that sends Buy and Sell signals for stock and cryptocurrency markets. Application uses trading algorithm to detect good time to Buy (asset is undervalued) or Sell (asset is overvalued). Signals are also published on X and Telegram.
Bull Market
- 🐂 Bull market is a financial market in which prices are growing or are expected to grow. Bull market usually comes with the economic growth.
- 💬 We analyze only popular market assets that usually grow over the long term (on the bull market).
Buy Signal
- 🤖 Algorithm has decided that current price is low (asset is undervalued). If you believe that the price will grow in the future – it's good time to buy.
- 💬 You should also check current trend for the asset, market and economic. If you believe that the asset, market or economic goes down – it's not good time to buy.
Sell Signal
- 🤖 Algorithm has decided that current price is high (asset is overvalued). If you believe that the price will fall in the future – it's good time to sell.
- 💬 You should also check current trend for the asset, market and economic. If you believe that the asset, market or economic goes up – it's not good time to sell.
Signal Strength
- ⚡ Signal strength shows how long the algorithm has been seeing the same price trend (grow or fall, price goes in the same direction).
- 💬 Higher signal strength may indicate that the trend may be changed in the nearest future. You should also check current trend for the asset, market and economic.
Disclaimer
- ⛔ No investment advice provided, investment is a risk, past performance is no guarantee of future results. We are not a licensed investment adviser.
- 🚫 We are not advising you personally concerning the nature, potential, value or suitability of any particular asset.
- 🧑🎓 You alone are solely responsible for determining whether any investment or strategy is appropriate or suitable for you based on your objectives, personal and financial situation.
Buy
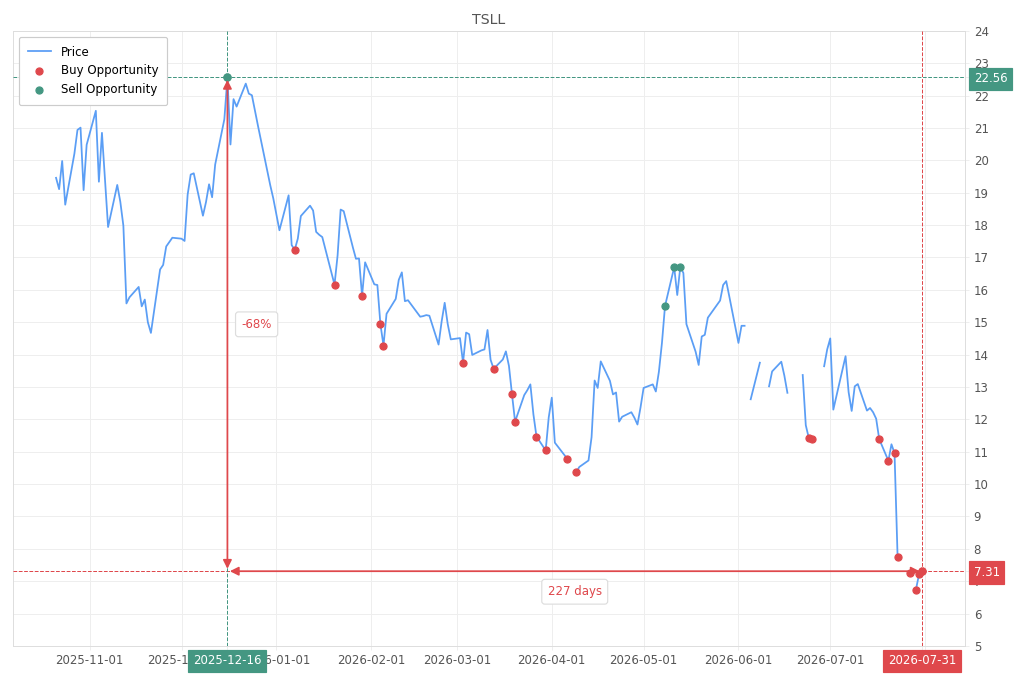
1TSLL: 7.31
July 31, 2026
| Price Dropped | Date |
|---|---|
-56% 16.71 | May 13, 2026 (127 days ago) |
-53% 15.5 | May 8, 2026 (132 days ago) |
-68% 22.56 | December 16, 2025 (275 days ago) |
Buy
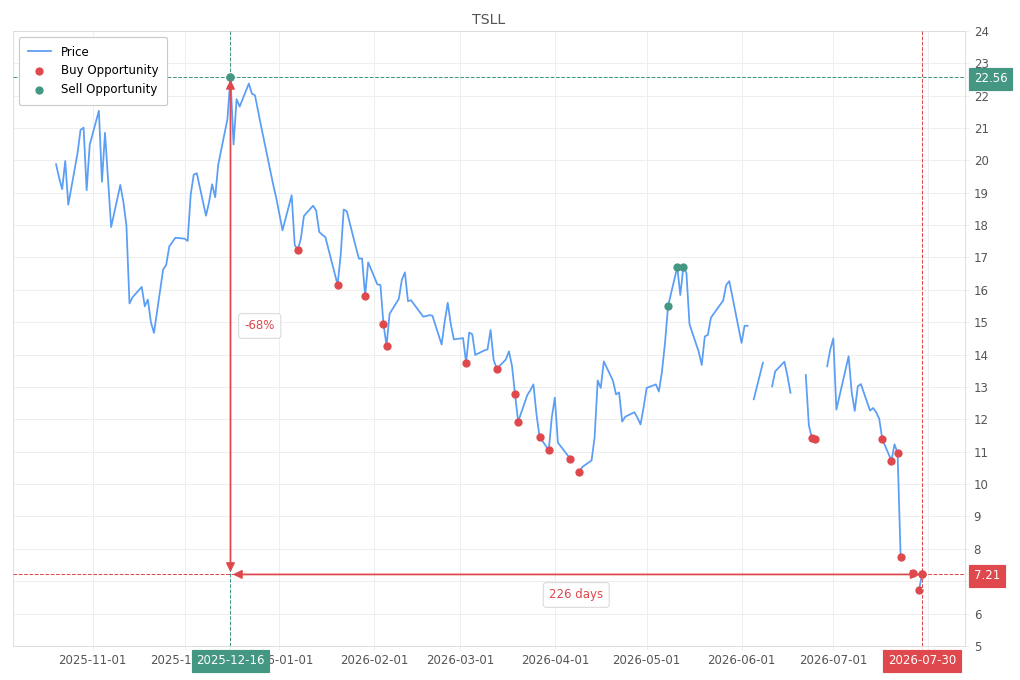
1TSLL: 7.21
July 30, 2026
| Price Dropped | Date |
|---|---|
-57% 16.71 | May 13, 2026 (127 days ago) |
-53% 15.5 | May 8, 2026 (132 days ago) |
-68% 22.56 | December 16, 2025 (275 days ago) |
Buy
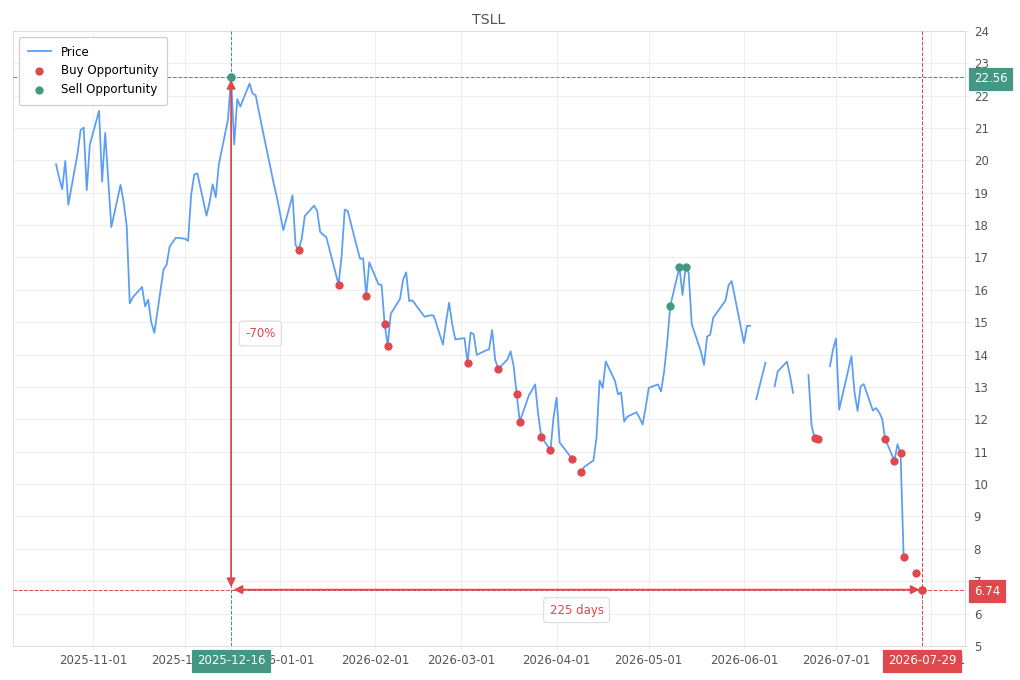
4TSLL: 6.74
July 29, 2026
| Price Dropped | Date |
|---|---|
-60% 16.71 | May 13, 2026 (127 days ago) |
-56% 15.5 | May 8, 2026 (132 days ago) |
-70% 22.56 | December 16, 2025 (275 days ago) |
Buy
3TSLL: 7.24
July 27, 2026
| Price Dropped | Date |
|---|---|
-57% 16.71 | May 13, 2026 (127 days ago) |
-53% 15.5 | May 8, 2026 (132 days ago) |
-68% 22.56 | December 16, 2025 (275 days ago) |
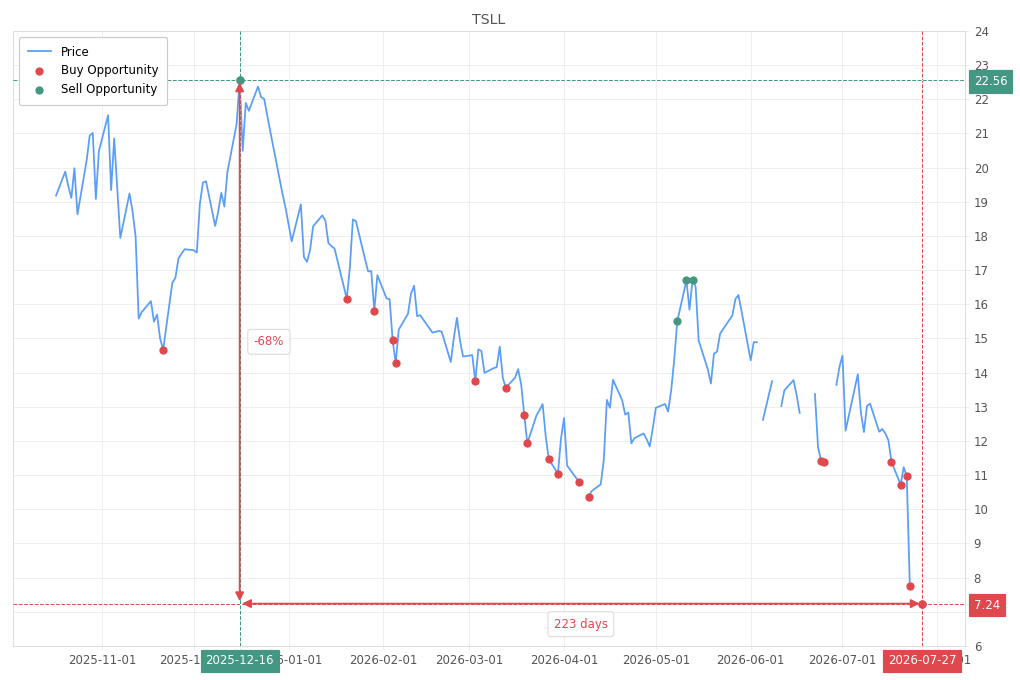
Buy
2TSLL: 7.76
July 23, 2026
| Price Dropped | Date |
|---|---|
-54% 16.71 | May 13, 2026 (127 days ago) |
-53% 16.7 | May 11, 2026 (129 days ago) |
-50% 15.5 | May 8, 2026 (132 days ago) |
-66% 22.56 | December 16, 2025 (275 days ago) |
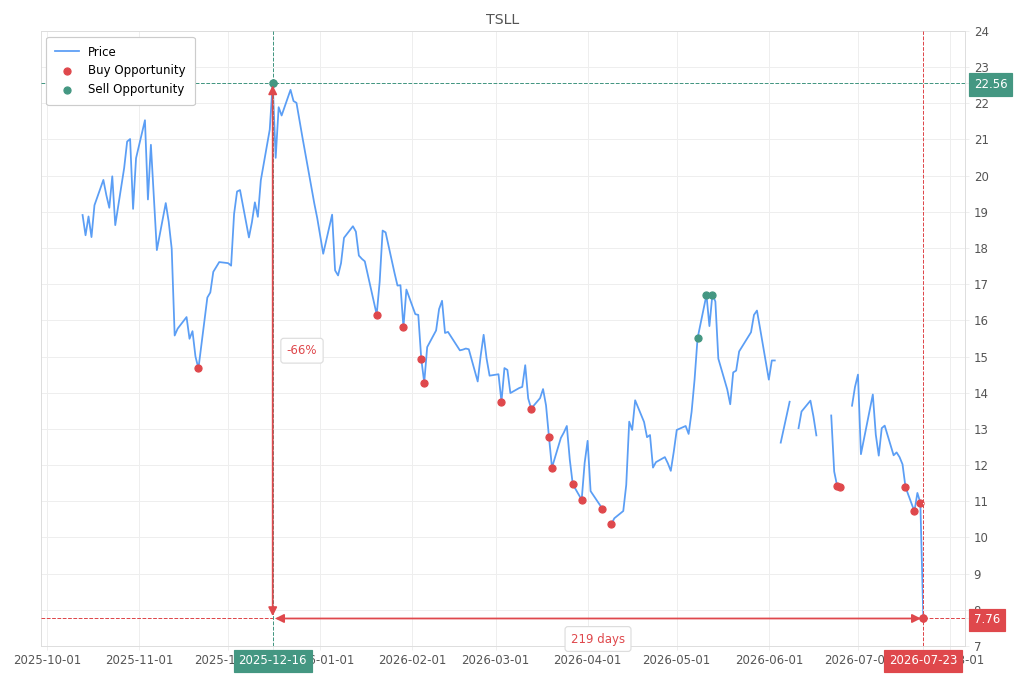
Buy
1TSLL: 10.96
July 22, 2026
| Price Dropped | Date |
|---|---|
-34% 16.71 | May 13, 2026 (127 days ago) |
-29% 15.5 | May 8, 2026 (132 days ago) |
-51% 22.56 | December 16, 2025 (275 days ago) |
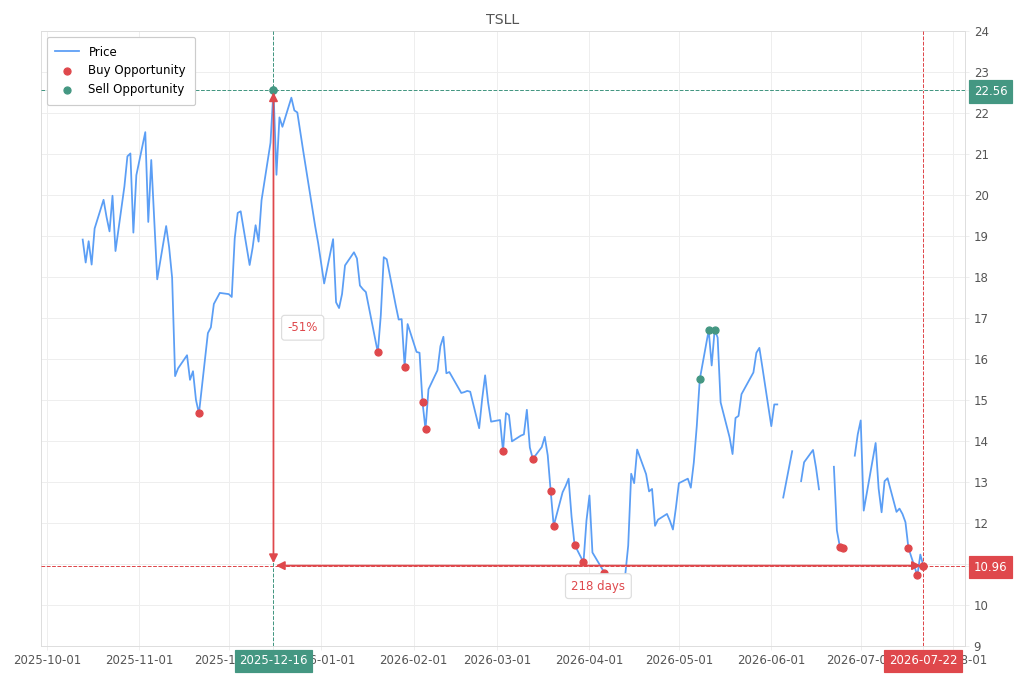
Buy
2TSLL: 10.72
July 20, 2026
| Price Dropped | Date |
|---|---|
-36% 16.71 | May 13, 2026 (127 days ago) |
-31% 15.5 | May 8, 2026 (132 days ago) |
-52% 22.56 | December 16, 2025 (275 days ago) |
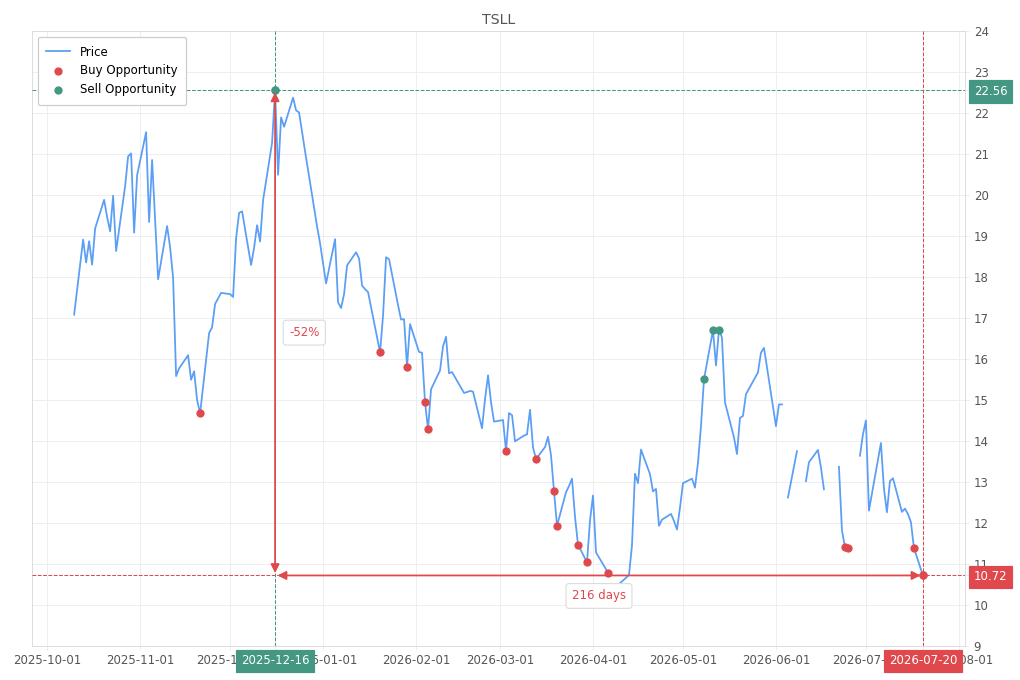
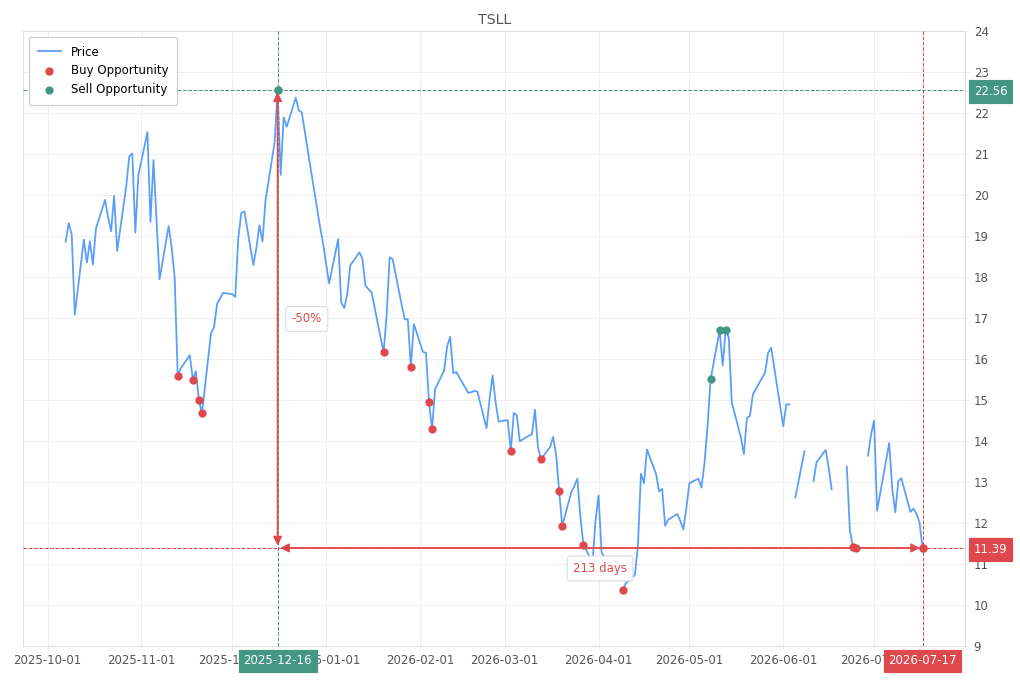
Buy
1TSLL: 11.39
July 17, 2026
| Price Dropped | Date |
|---|---|
-32% 16.71 | May 13, 2026 (127 days ago) |
-26% 15.5 | May 8, 2026 (132 days ago) |
-49% 22.56 | December 16, 2025 (275 days ago) |
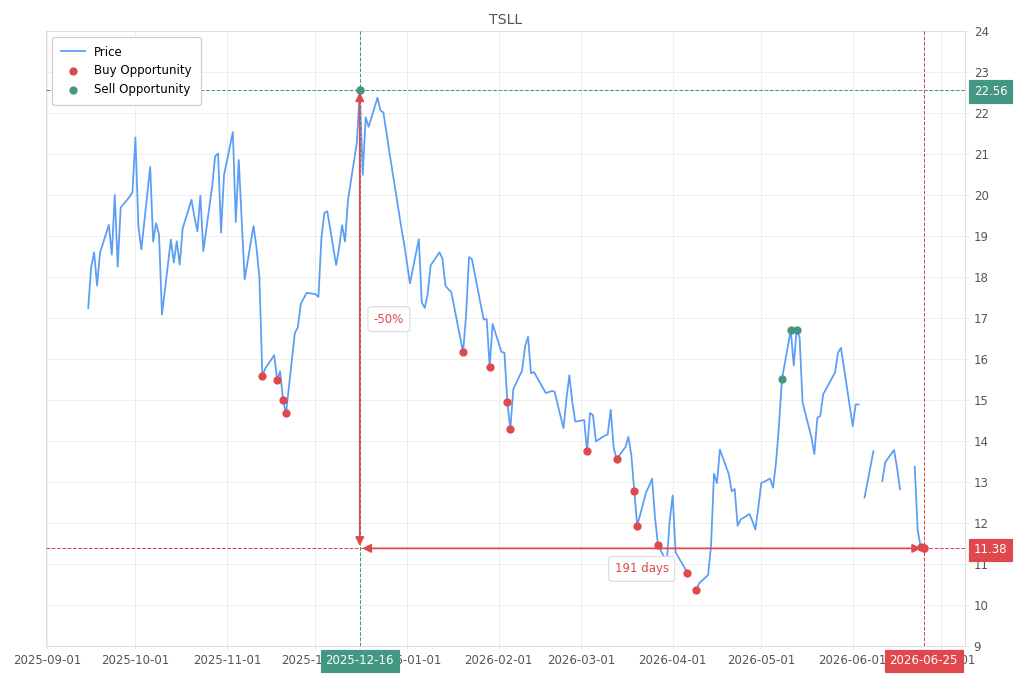
Buy
2TSLL: 11.38
June 25, 2026
| Price Dropped | Date |
|---|---|
-32% 16.71 | May 13, 2026 (127 days ago) |
-27% 15.5 | May 8, 2026 (132 days ago) |
-50% 22.56 | December 16, 2025 (275 days ago) |
Buy
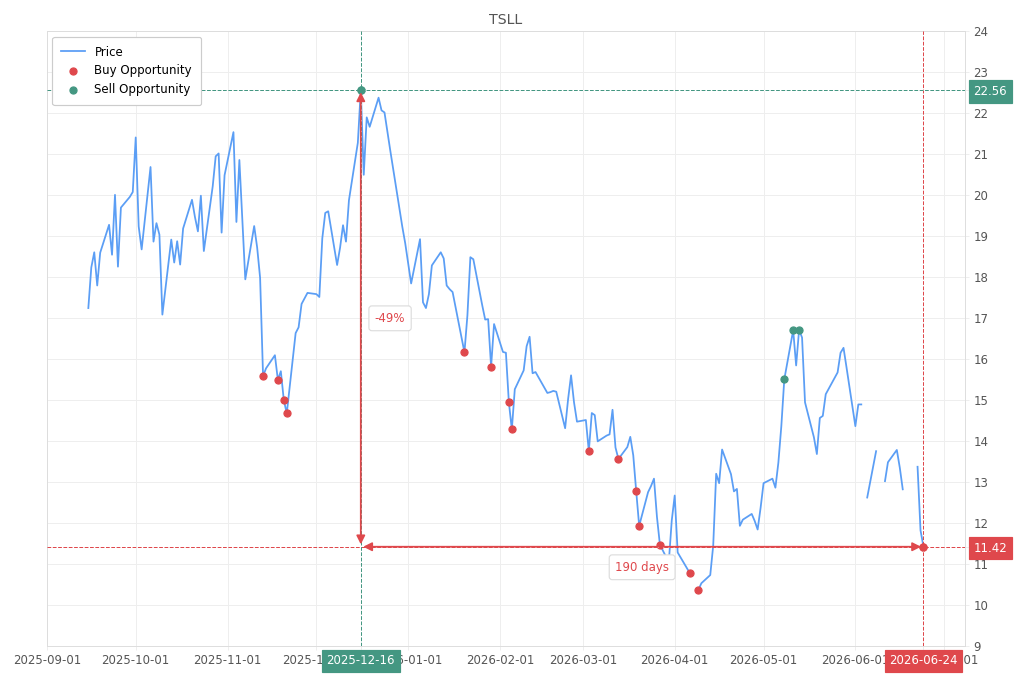
1TSLL: 11.42
June 24, 2026
| Price Dropped | Date |
|---|---|
-32% 16.71 | May 13, 2026 (127 days ago) |
-26% 15.5 | May 8, 2026 (132 days ago) |
-49% 22.56 | December 16, 2025 (275 days ago) |